A new dataset released by the University of Richmond’s Digital Scholarship Lab is enabling researchers to precisely track the long-term effects of redlining, the discriminatory lending practice that denied loans and investments in predominantly Black neighborhoods. The dataset, called “Mapping Inequality,” combines historical redlining maps with modern census data, allowing for detailed analysis of how the practice has shaped racial disparities and segregation patterns that persist today.
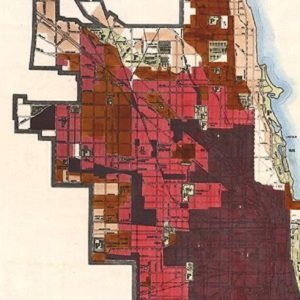
Redlining, which began in the 1930s, graded neighborhoods based on perceived lending risk, with areas deemed “hazardous” – often those with high concentrations of Black residents – colored in red. Banks used these maps to deny loans and mortgages, leading to disinvestment, poverty, and segregation in redlined communities.
By overlaying redlining boundaries onto 2010 census data and 2018 American Community Survey estimates, the Mapping Inequality dataset reveals stark disparities between formerly redlined neighborhoods and those that received preferential treatment. Redlined areas continue to have higher poverty rates, lower home values, and less access to resources like healthcare and education.
Researchers hope this granular data will support efforts to address systemic inequities and inform policies aimed at undoing the legacy of redlining. The dataset’s creators emphasize the importance of understanding history to create a more just future.
See “New Dataset Empowers Researchers To Precisely Track The Effects Of Redlining Over Time” (May 28, 2024)